Home e-Pay Doing Business News Employment Questions Conservation Water Quality Map


Conservation of Water Resources


Summit Water’s Proposed Water Use Efficiency Measures and Goals


Water Use Efficiency Rule

In 2003, the Washington State Legislature passed the Municipal Water Law (MWL).  This law established that all municipal water suppliers must use water more efficiently in exchange for water right certainty and flexibility to help them meet future demand.  The State Health Department has been directed to adopt an enforceable Water Use Efficiency (WUE) program intended to achieve a high level of stewardship among all municipal water suppliers.


Conservation Program Background

In 1993, Summit Water & Supply Company (SWC) conducted a study to analyze the water demand characteristics with an eye toward determining opportunities for conservation.  A conservation program was drafted and implemented using the information obtained from this study.  In 1999, 2008 and again in 2014, Summit Water revisited and updated its conservation program, which resulted in addressing and implementing additional conservation measures.  Although Summit Water’s conservation program addresses both supply (source) and demand (customer) elements, from the standpoint of a conservation program, we believe that the demand side is ultimately the key to realizing significant savings.  Through continued cooperation between Summit Water and its customers/members we will ensure an adequate supply of water now and well into the future.


1993 Conservation Measures

Summit Water originally implemented the following measures into its 1993 conservation program and continues to do so in its current program:

  • Contracted with independent leak detection company to perform water leakage audits, and repair/fix leaks as detected;
  • Purchased electronic leak detection equipment for use by Summit Water personnel in performing mainline and service line leak detection;
  • Initiated a comprehensive water meter change-out and service program, which replaced old meters with either new or newly calibrated meters.  The meter change-out program was initially based on full replacement of meters within a 15 year cycle;
  • Make available toilet tank leak detection tablets to customers at Summit Water’s main office.  Tablets are inserted into the toilet holding tank and if dyed water appears in the lower bowl this indicates a leaking flapper valve.
  • Make available rain gauges for customer to use in determining the number of inches of rainfall or irrigation water deposited on their yard or landscaped areas.
  • Installed meters on all water transfer connections to or from Summit Water’s system, with the most significant portion of this program being the installation of water lubrication meters on all vertical lineshaft turbine pumps; and
  • Continued customer conservation information/education through use of an annual news letter, billings and consumer confidence reports (CCRs).


Current Conservation Measures

Along with those previously listed are additional measures that have been implemented into Summit Water’s conservation program since 1999:

  • Provide customers/members information concerning water efficient fixtures and appliances, and encourage their use through education.  Following is data provided by the AWWA and EPA, which indicates that installing water conserving fixtures can reduce indoor residential water use by approximately 23% verse no conservation.

  • Support county initiatives to revise and/or develop building/plumbing code ordinances for water efficient construction;

  • Support the development and implementation of State conservation guidelines and local landscaping ordinances which promote water efficient use;

  • Require a separate, interruptible meter for all playfields, parks, community, medium and large use irrigators;

  • Design and implement a “Supervisory Control and Data Acquisition” (SCADA) system, which can be used to program the operation of water sources and other facilities for maximum use efficiency;

  • Require an engineered “Landscape Plan” for all playfields, parks, community, medium and large use irrigators.  These plans determine the overall square footage of an area to be irrigated.  This information is then used to establish irrigation “block rate intervals” based on the square footage of irrigated area.  The first block allows for up to 1” of water per week based on the square footage calculation.  The second block is for usage greater than 1” but not exceeding       1-1/4” based on the square footage calculation.  While the third block is for usage greater than 1-1/4” based on the square footage calculation;

  • Notify customer of potential leaks based on abnormally high meter readings.  The criteria for establishing an abnormally high meter reading is based on an increase of at least twice the average consumption for the same billing period in the prior two years.  Upon the billing system identifying an account meeting the criteria, billing department personnel notifies the customer of our findings.  The customer is advised on where to find information regarding leak detection services and may be awarded a leak credit on leaks occurring between the meter and the house towards the water usage portion of the bill, above their normal consumption for the same billing period if the leak is repaired in a timely manner;

  • Water meter connections which provide potable water are calculated and sized in part using the fixture count table in the “Uniform Plumbing Code”.  Excluded from the fixtures count calculations are water connections which provide for the external use of water (i.e. irrigation, hose bibs, swimming pools);

  • Provide customers with historic water consumption on their monthly and bi-monthly bill. The data provided is shown by use of bar graph chart for the previous twelve (12) billings and provides water consumption in units by billing period;

  • Develop and implement an inverted block rate structure.  This rate structure was designed to reward water conservation with lower bills for lower usage.  The current water rate structure is an inverted block rate (three tiered), which means as a customer’s usage increases, their rates increase accordingly within the three block rates.  Prior to the inverted block rate structure, many customers were carrying the burden of costs associated with service to customers demanding higher water usage.  The inverted block rate system places these costs more evenly on the basis of level of water units used;

  • Continued education/information sharing with customers through use of Summit Water’s annual letter, web site, water bill information center and through our participation as a member of the Regional Water Cooperative of Pierce County.


Current Conservation Goals & Results

Summit Water's current conservation goals are based on achieving the goals within a six-year period.  The goals set were as follows; reduce the average peak day demand (PDD) by 0.25% per user, per year, based on a rolling six-year average and reduce Distribution System Leakage (DSL) water to 10 percent or less based on a three-year rolling average.

A.    Reduce average peak day demand by 0.25% per user, per year, based on a rolling six-year average - Based on this six-year rolling average, our average peak day demand (PDD) per user for 2008-2013 was set at 546.3.  Since setting the new conservation goals for 2014 through 2019, Summit Water has achieved an average peak day demand per user as follows:

Ø  2009-2014:  Avg. PDD Goal is 544.9 gpd - Actual is 528.7 gpd  (-3.0%)

Ø  2010-2015:  Avg. PDD Goal is 543.5 gpd - Actual is 562.5 gpd  (+3.5%)

Ø  2011-2016:  Avg. PDD Goal is 542.2 gpd - Actual is 540.1 gpd  (-0.4%)

Ø  2012-2017:  Avg. PDD Goal is 540.8 gpd - Actual is 545.7 gpd  (+0.9%)

Ø  2013-2018:  Avg. PDD Goal is 539.5 gpd - Actual is 548.5 gpd  (+1.7%)

Ø  2014-2019:  Avg. PDD Goal is 538.1 gpd - Actual is 544.4 gpd  (+1.2%)

B.     Reduce Distribution System Leakage (DSL) water to 10% or less based on a rolling three-year average - From 1994 to 2013 Summit Water had DSL water loss of 1,578,577,683 gallons or an average DSL loss of 12.4 percent.  Since resetting this goal in 2014, Summit Water has had a DSL water loss of 409,461,738 gallons or an average DSL loss of 10.5 percent.  Following are the three-year rolling averages for Distribution System Leakage since resetting this goal in 2014:

Ø     2012-2014:  DSL water is 138,404,863 gallons (7.8%)

Ø     2013-2015:  DSL water is 135,381,655 gallons (7.6%)

Ø     2014-2016:  DSL water is 191,562,931 gallons (9.8%)

Ø     2015-2017:  DSL water is 232,892,938 gallons (11.4%)

Ø     2016-2018:  DSL water is 227,037,447 gallons (11.0%)

Ø     2017-2019:  DSL water is 217,898,807 gallons (11.0%)


Company Background

Summit Water & Supply Co. is a not-for-profit corporation organized under Chapter 24 RCW.  The company was originally established in 1923 and incorporated 1936.  Summit Water provides domestic, commercial and light industrial service to approximately 6,950 customers in north central Pierce County.  The service area lies between the corporate boundaries of Tacoma and Puyallup and south of the Puyallup River to 128th St. E.  Summit Water serves in the low alluvial plain of the river, along the valley escarpment, and on the upland plateau.  Most of Summit’s Water service area is designated “Rural Separator”, but there are several small areas of higher density and non-residential land use.  The company’s service area is fixed under the Pierce County Coordinated Water System Plan and Summit currently has no plans to expand its service area.  Summit Water has entered into interlocal service area agreements as required by the Pierce County Coordinated Water System Plan.

Though nearly surrounded by urban areas, Summit Water’s service area is mostly designated as “Rural Separator” and excluded from Pierce County’s urban growth area.  Much of the area is nearly rural in character with large lots and some agricultural uses.  Higher density residential development is concentrated along the east side of Summit Water’s service area.  Some multi-family residential is included in Summit Water’s mix (about 29%) and this has been the fastest growing class of customers.  Non-residential development is found in small centers, such as Summit Center near 112th St. & Canyon Rd. E., and along major arterial roads.  The company also serves some trust lands of the Puyallup Nation, some of which are developed with residential and institutional uses.

Summit Water operates a gravity supply system with approximately 3,850 gallons per minute (gpm) of source capacity and two 1,500 gpm (emergency) propane booster pumps capable of supplying water when the gravity supply system is unable to meet the demand.  Total storage volume is approximately seven million gallons.  There are five pressure zones required to maintain suitable pressures on the system.  The principal pressure zone is at a hydraulic grade elevation of 595'.  Additional pressure zones are located at 522’, 390’, 205’ and 125’.  The lower pressure zones rely in part on supply provided through pressure reducing valves.

The water supply is entirely groundwater, from a total of six wells at four sites.  All water sources are treated with chlorine for disinfection of the distribution system.  Other water treatment includes the injection of caustic soda for pH adjustment to address corrosion control (copper levels).

Summit Water has water rights for a total of 3,800 gallons per minute, and 2,130 acre-feet or 694,015,770 gallons per year.  Additional sources of water include emergency interties with Fruitland Mutual (1), Tacoma City Water (3) and one intertie with Parkland Light & Water.  Summit Water also purchases wholesale water from the Lakewood Water District.  The existing wholesale agreement between Summit Water and Lakewood Water is for a total transfer/purchase of 3.0 million gallons per day (MGD) but is currently limited to take of 1.5 MGD.  Full take (3.0 MGD) of the Lakewood wholesale water will occur as defined in the contract's "Supply Schedule".  The purchase of wholesale water from Lakewood is in addition to Summit's existing water rights.

In 1997, the Washington State Department of Ecology issued superseding certificates for all of Summit Water’s water rights that extended the place of use to include the areas served by other members of the Pierce County Water Cooperative.  The purpose of this requested amendment to Summit’s water rights was to facilitate transfer of water between these systems to bring water that is available to areas where it is needed and could be put to beneficial use.  


System Demand Characteristics

An evaluation of Summit Water’s annual water production and customer census (table 1) from 2006 through 2019 revealed that the average daily demand varied year to year from a low of 211 gallons per day (gpd) to a high of 261 gpd for all users, with the overall average being about 233 gpd.  Also noted from this evaluation was that Summit Water’s average peak day demand (PDD) varied year to year from a low of 479 gpd to a high of 674 gpd, with an overall average of 561 gpd. 

The most recent peak day was measured by Summit Water’s production instruments on August 6, 2019.  On this day, 3,331,446 gallons of water were pumped from all available sources.  Net change in tank volume for the day was measured at approximately 30,000 gallons.  A total of 3,361,446 gallons was consumed by 6,950 customer units.  This resulted in an average of 484 gallons being produced for each customer unit on the peak day.  


Proposed Growth

Summit Water’s retail service area consist of approximately 6,550 parcels.  This estimate is made from map records obtained from the Pierce County Assessor’s office and information in Summit’s member files.  Active commitments for service include 33 pending water availability certificates.  These certificates are approved for an estimated 248 additional users.  The high number of estimated users verses pending water certificates reflects the increasing multi-family and condominium development within the Summit area.

Restrictions on further subdivision of land will determine whether and to what extent new lots are created.  Most of Summit Water’s service area falls within the “Mid-County Community Plan” and is designated “Rural Separator”, which carries a 2.5 acre minimum restriction.  Considering restricted land uses and density, Summit Water's commitments on active water availability certificates and the high proportion of lots of record already served by the company, Summit Water's existing system may be considered to be approaching the limits of growth.

In order to estimate the future number of users, assumptions must be made for the number of users that arise from development of the remaining lots, and possible additions of users to lots already developed.  The small areas of mixed and moderate density use within Summit Water’s service area may be developed by further subdivision of land.  
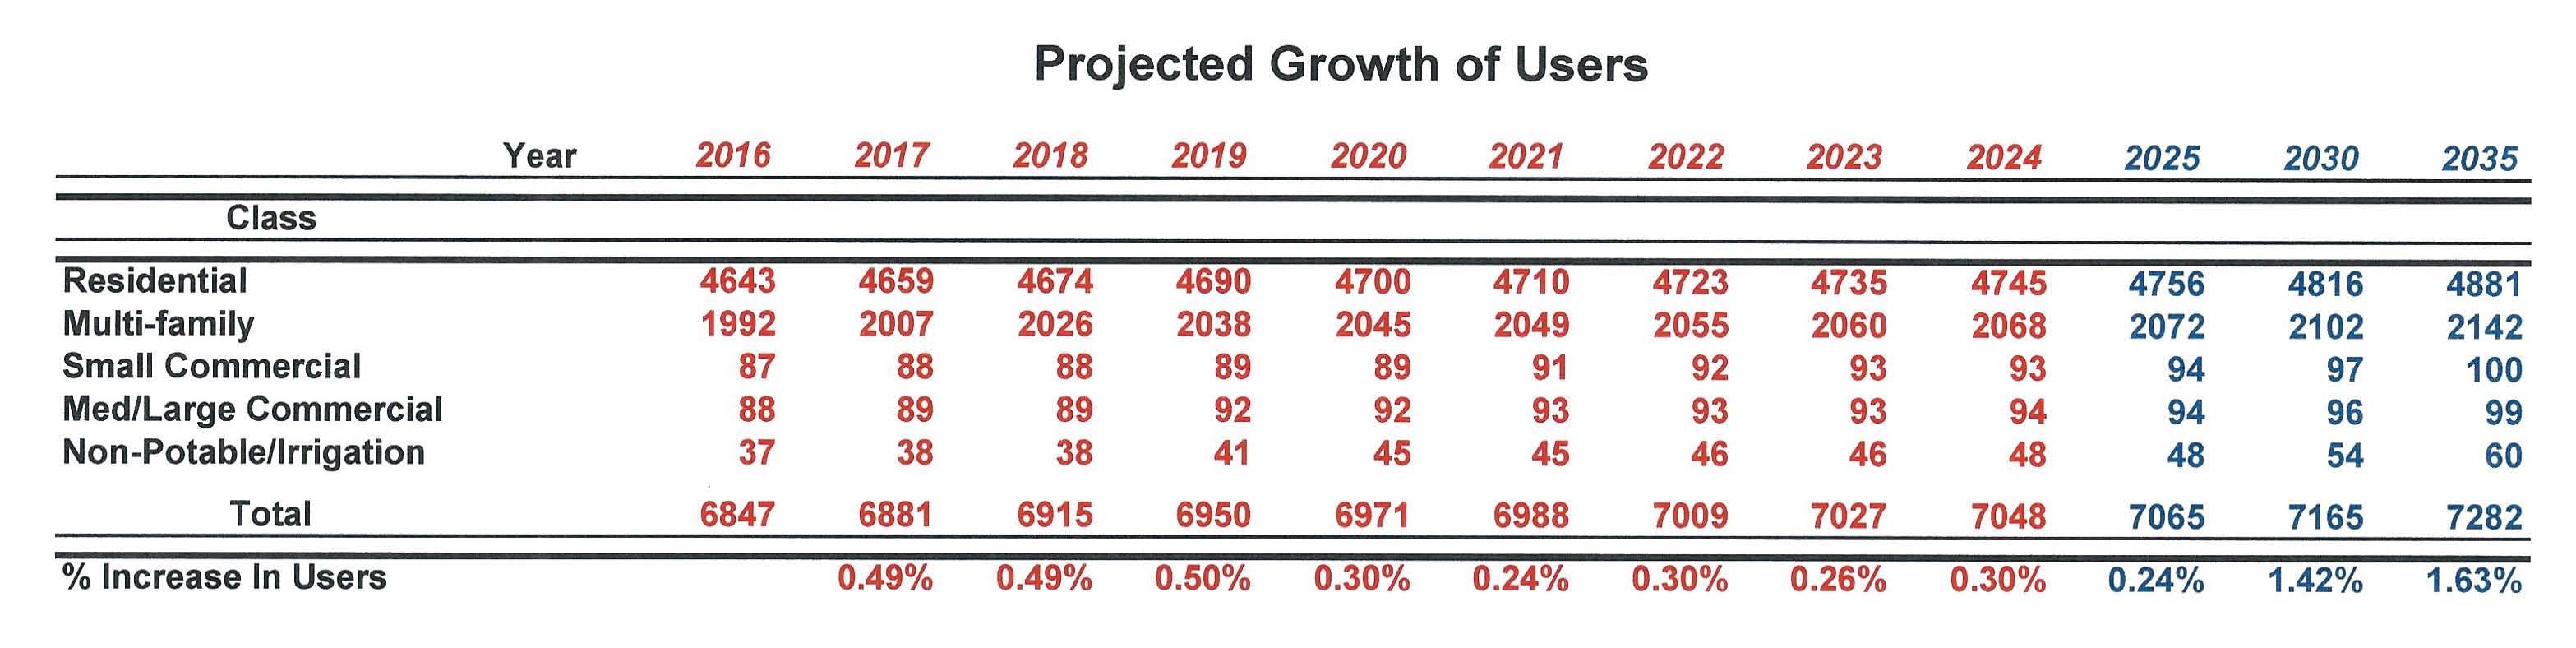
As part of Summit Water's latest water system plan, a "buildout analysis" was conducted to determine the total number of users the system is capable of serving.  Based on remaining buildable land and current zoning, it is estimated that together with the committed service to the current 6,950 users that an additional 1,824 users could be added to the system.


Customer Class/Billing System

In 1989, Summit Water implemented new billing software and, as part of that system, developed a formal set of customer classes.  Data entered into the billing software included the customer type, the number of units served and the bi-monthly amount of water consumed.  The 8 classes of customers are assigned as follows:

Customer Class

                          Residential

                          Multi-family

                          Small Commercial

                          Medium Commercial

                          Larger Commercial

                          Industrial/Special Use

                          Irrigation

                          Fire

The volume of water used by each customer in each billing period, beginning in 1990, could be extracted from the database by the billing software.  This data provides a means of evaluating the characteristic monthly and annual demand by customer classes and number of units.


Rate Structure

Rate structures are an important component of promoting water conservation.  Additional factors, such as metering, billing frequency, the need for resources and Distribution System Leakage (DSL) water can all impact conservation efforts.

Based on the rate structure in place, customers make decisions to consume or not consume water.  Generally, higher water rates lead to lower water consumption.  By structuring conservation-oriented rates which are higher at certain usage levels, customers will be encouraged to consume less water overall.  It is important to note that conservation-oriented rates are meant to restructure rate components rather than increasing rates overall.

In 2000, Summit Water implemented an inverted block rate structure, which separated consumption levels into three blocks, with rates per unit increasing as the level of consumption increases.  Block rates have been set in relation to system consumptions for each customer class.  Based on this type of rate structure, customers who have higher levels of consumption within a particular customer class will face higher rates and therefore will pay higher cost.

For Summit Water’s conservation rates to be effective, meters are frequently read and customers billed in a timely manner.  Monthly or bi-monthly meter reading and billing provide timely information on water consumption such that conservation rates can be more effective.

To help our customers better understand their consumption patterns and take measures to conserve water, Summit Water provides a historical consumption comparison (bar graph chart) on all water bills showing the past twelve billings for all customer classes.

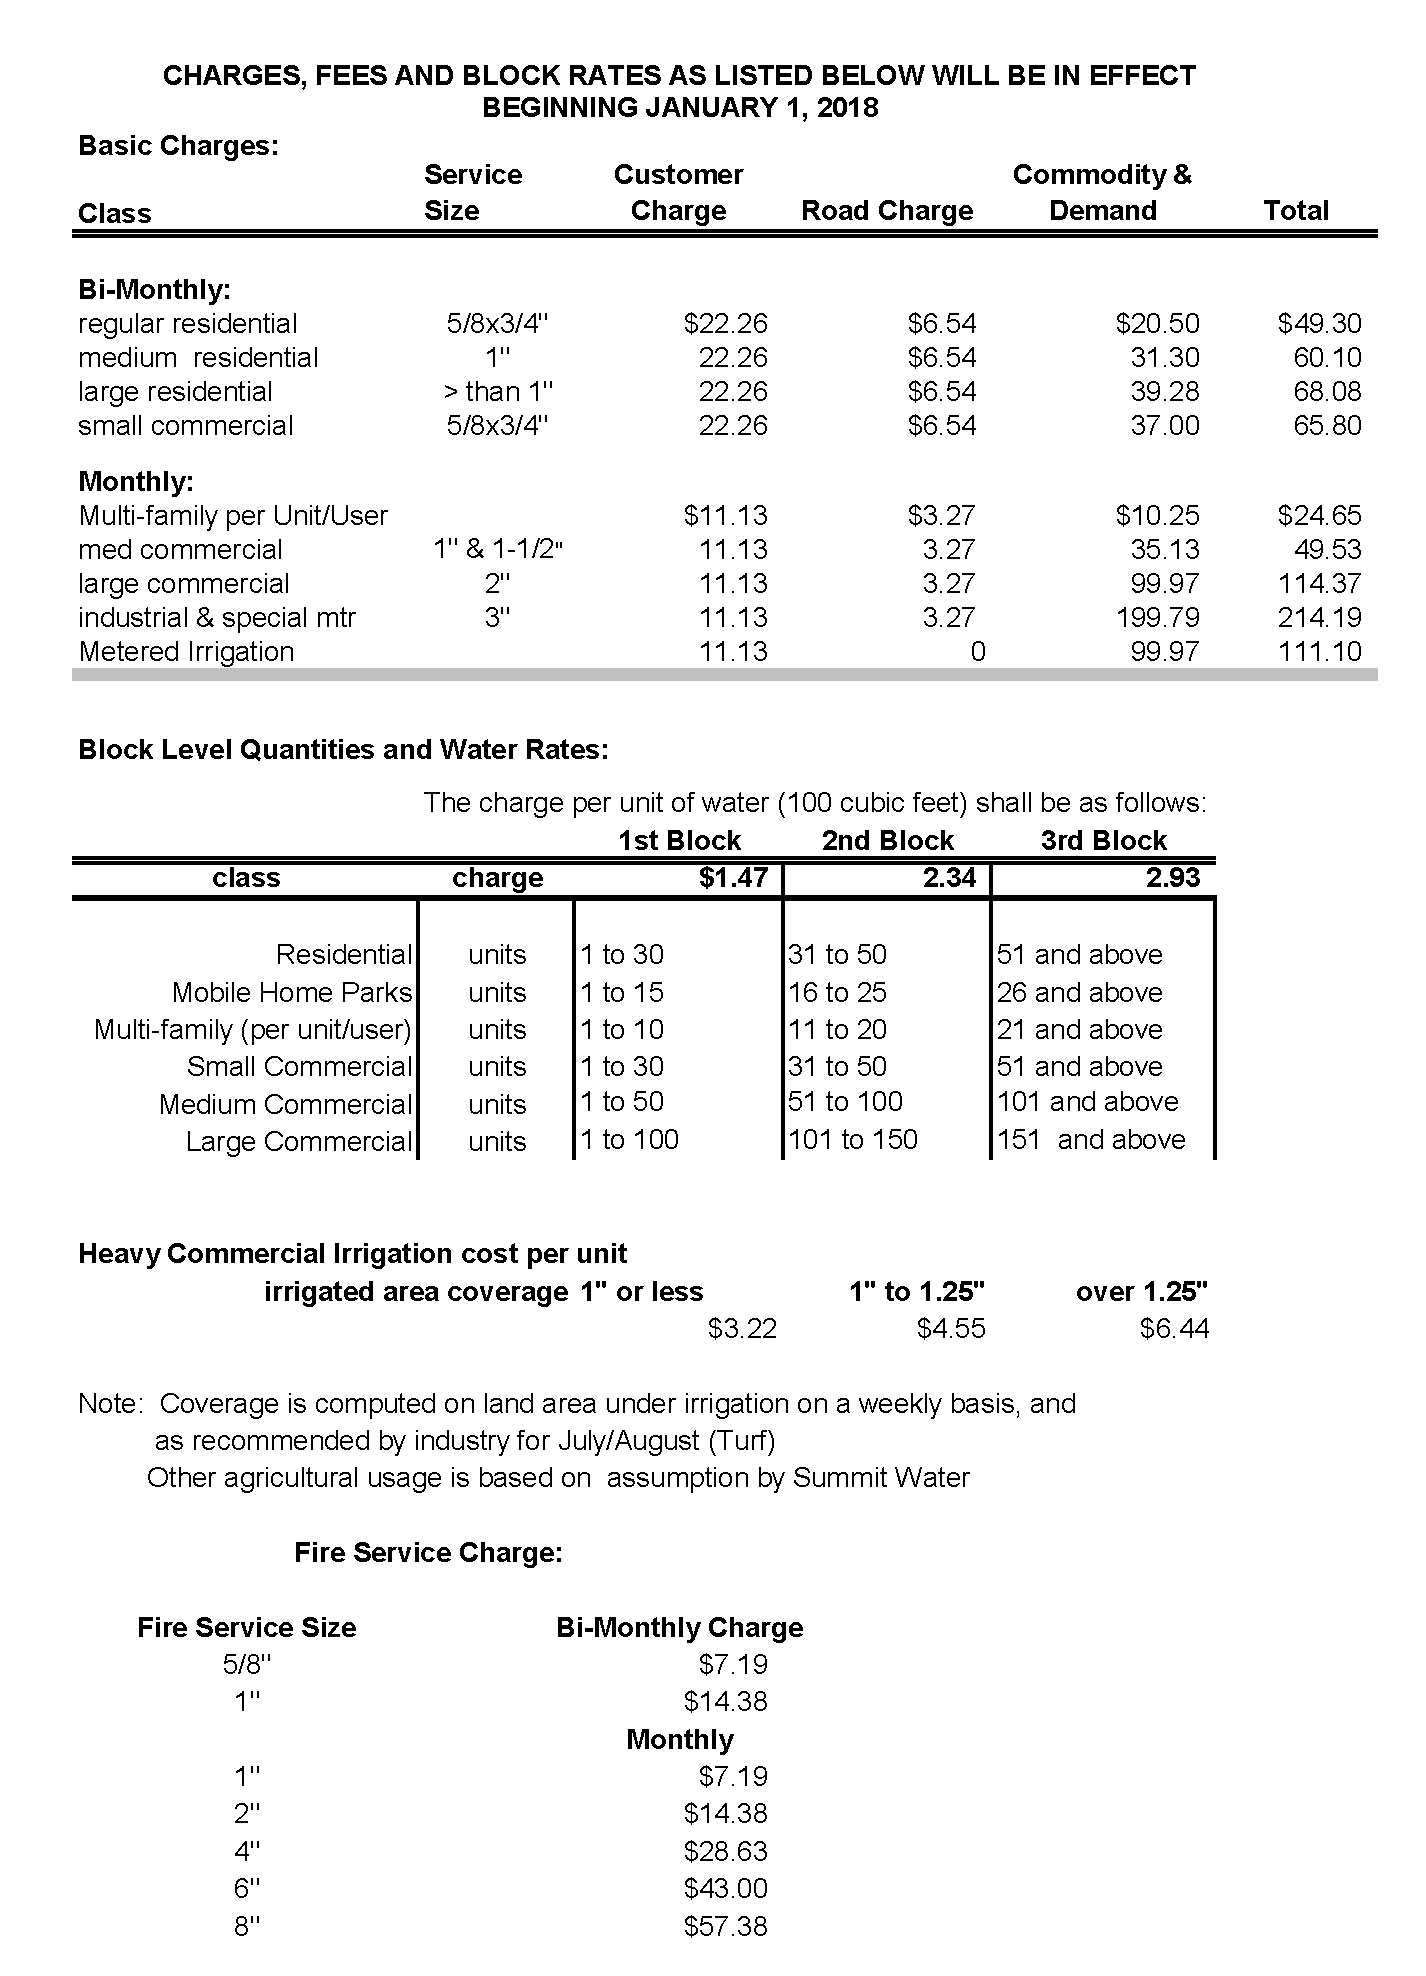
Following is Summit Water’s current rate schedule and charges for all customer classes, which went into effective on January 1, 2018:


Conservation Program Measures

As defined in “Table 5-1” of the “Water Use Efficiency Guidebook” and based on the number of connections, Summit Water is required to identify and implement six (6) water use efficiency measures.  Based on Summit Water’s current conservation measures, we exceed the number of measures needed to satisfy the “Water Use Efficiency” (WUE) rule.   Following are the measures Summit Water has chosen to use for meeting the WUE rule for the reporting period of 2020 to 2025:

1)      Summit Water is currently using an inverted block rate structure for billing of its residential, multi-family, commercial and irrigation class customers.  This rate structure was designed to reward water conservation with lower bills for lower usage.  The current water rate structure is an inverted block rate (three tiered), which means as a customer’s usage increases, their rates increase accordingly within the three block rates.  As noted in “Chapter 5” of the “Water Use Efficiency Guidebook”, this WUE measure is being implemented for four (4) different customer classes, therefore it will count as four (4) measures;

2)      Summit Water currently provides its residential, multi-family, commercial and irrigation customers with historic water consumption on their monthly and bi-monthly bill.  The data provided is shown by use of bar graph chart for the previous twelve (12) billings and provides water consumption in units by billing period.  This helps our customers better understand their consumption patterns and take measures to conserve water.  As noted in “Chapter 5” of the “Water Use Efficiency Guidebook”, this WUE measure is being implemented for four (4) different customer classes, therefore it will count as four (4) measures;

3)      During the billing process, if an account is flagged as having an abnormally high meter reading (at least twice the average consumption for the same billing period in the prior two years) billing staff will notify the customer of our findings and provided advice on where to find information regarding leak detection services.  Upon verification by Summit Water that the leak has been repaired, a customer may apply for and may be awarded a leak credit. If a credit is awarded it shall only apply towards the water portion of the bill above their normal consumption for the same billing period.  Leaks must be repaired in a timely manner in order to be considered for a leak credit.  As noted in “Chapter 5” of the “Water Use Efficiency Guidebook”, this WUE measure is being implemented for four (4) different customer classes, therefore it will count as four (4) measures;

4)      Continued education and information sharing with customers through use of Summit Water’s annual letter, web site, water bill information center and through our participation as a member of the Regional Water Cooperative of Pierce County.

Summit Water is proud of the progress it has made in reducing the average annual and peak day demand per customer as well as our continued efforts to reduce the Distribution System Leakage (DSL) water to below 10%.  As stated above and detailed in the beginning of this document, Summit Water has already implemented a number of conservation elements that meet and exceed the requirements of the WUE rule and will continue the use of these measures in meeting future conservation goals.


Summit Water's WUE Goals

Summit Water’s conservation goals for this planning period will be to reduce the average daily demand (ADD) by at least 0.25% per user per year based on a rolling six-year average.  This should reflect a general reduction of usage at a rate of approximately 0.25% per year for all users over the next six years.  The use of a rolling six-year average is to reduce impacts of any given year being particularly warm and dry or cool and wet.

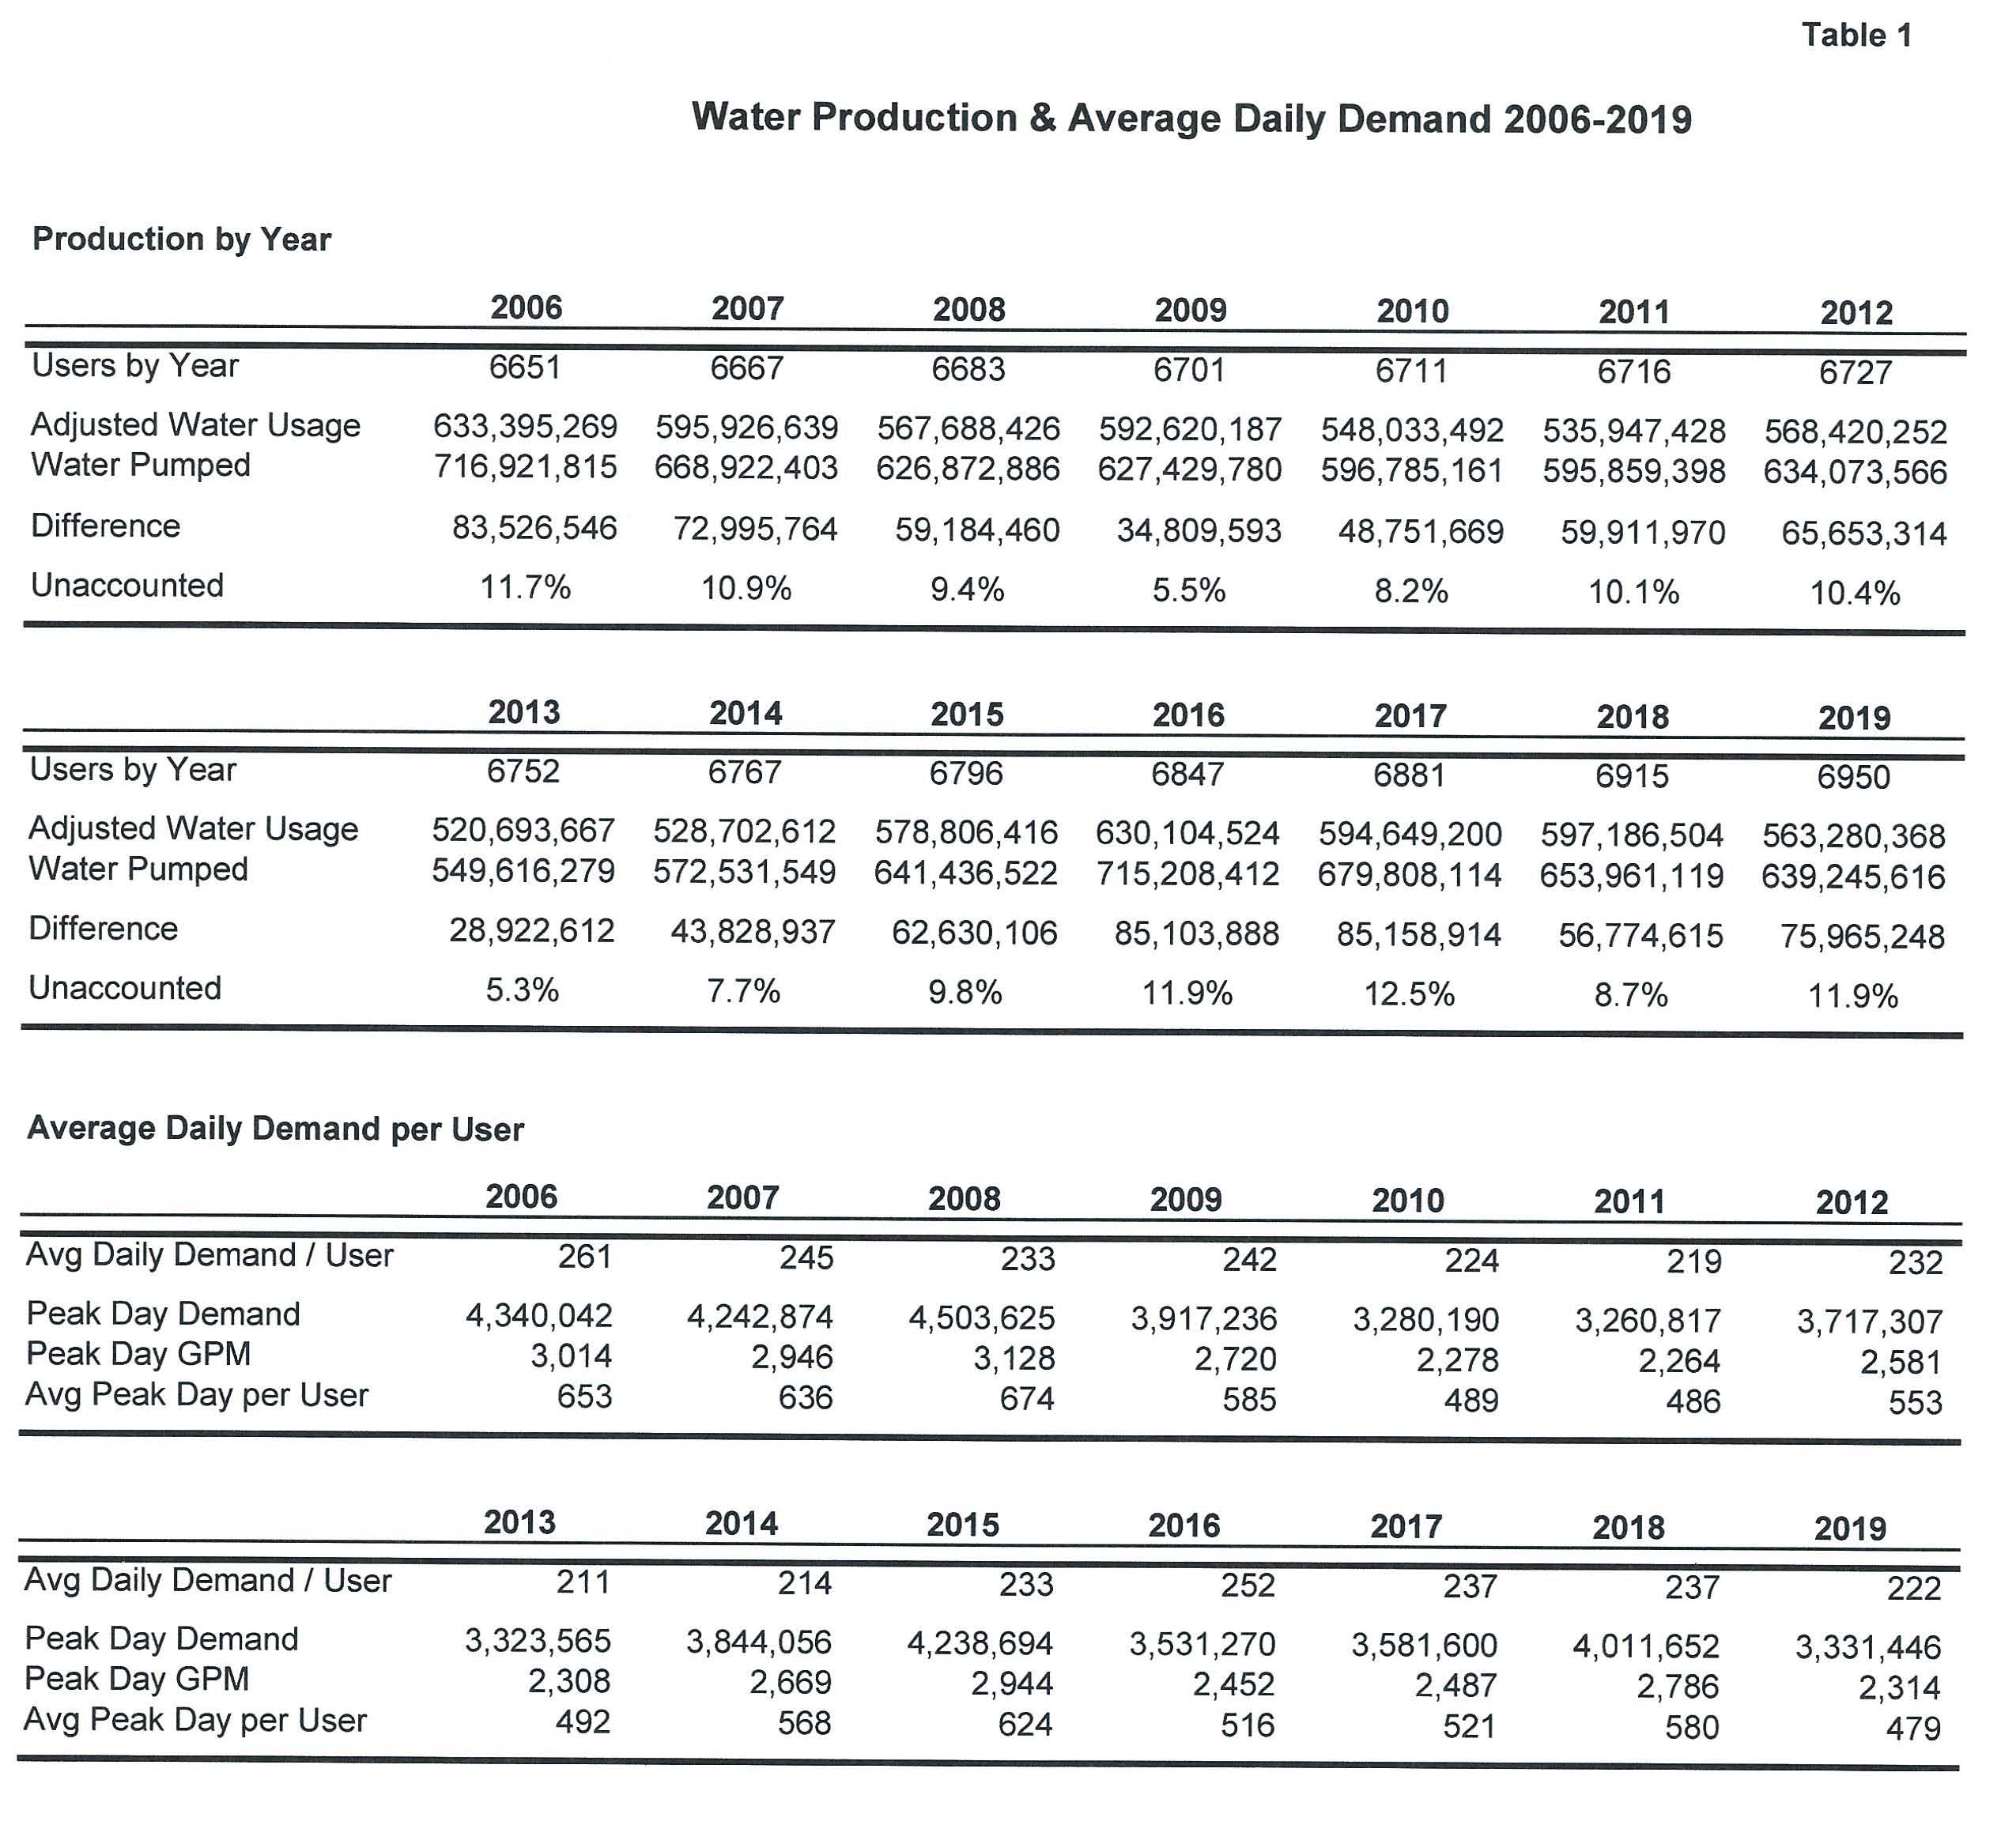
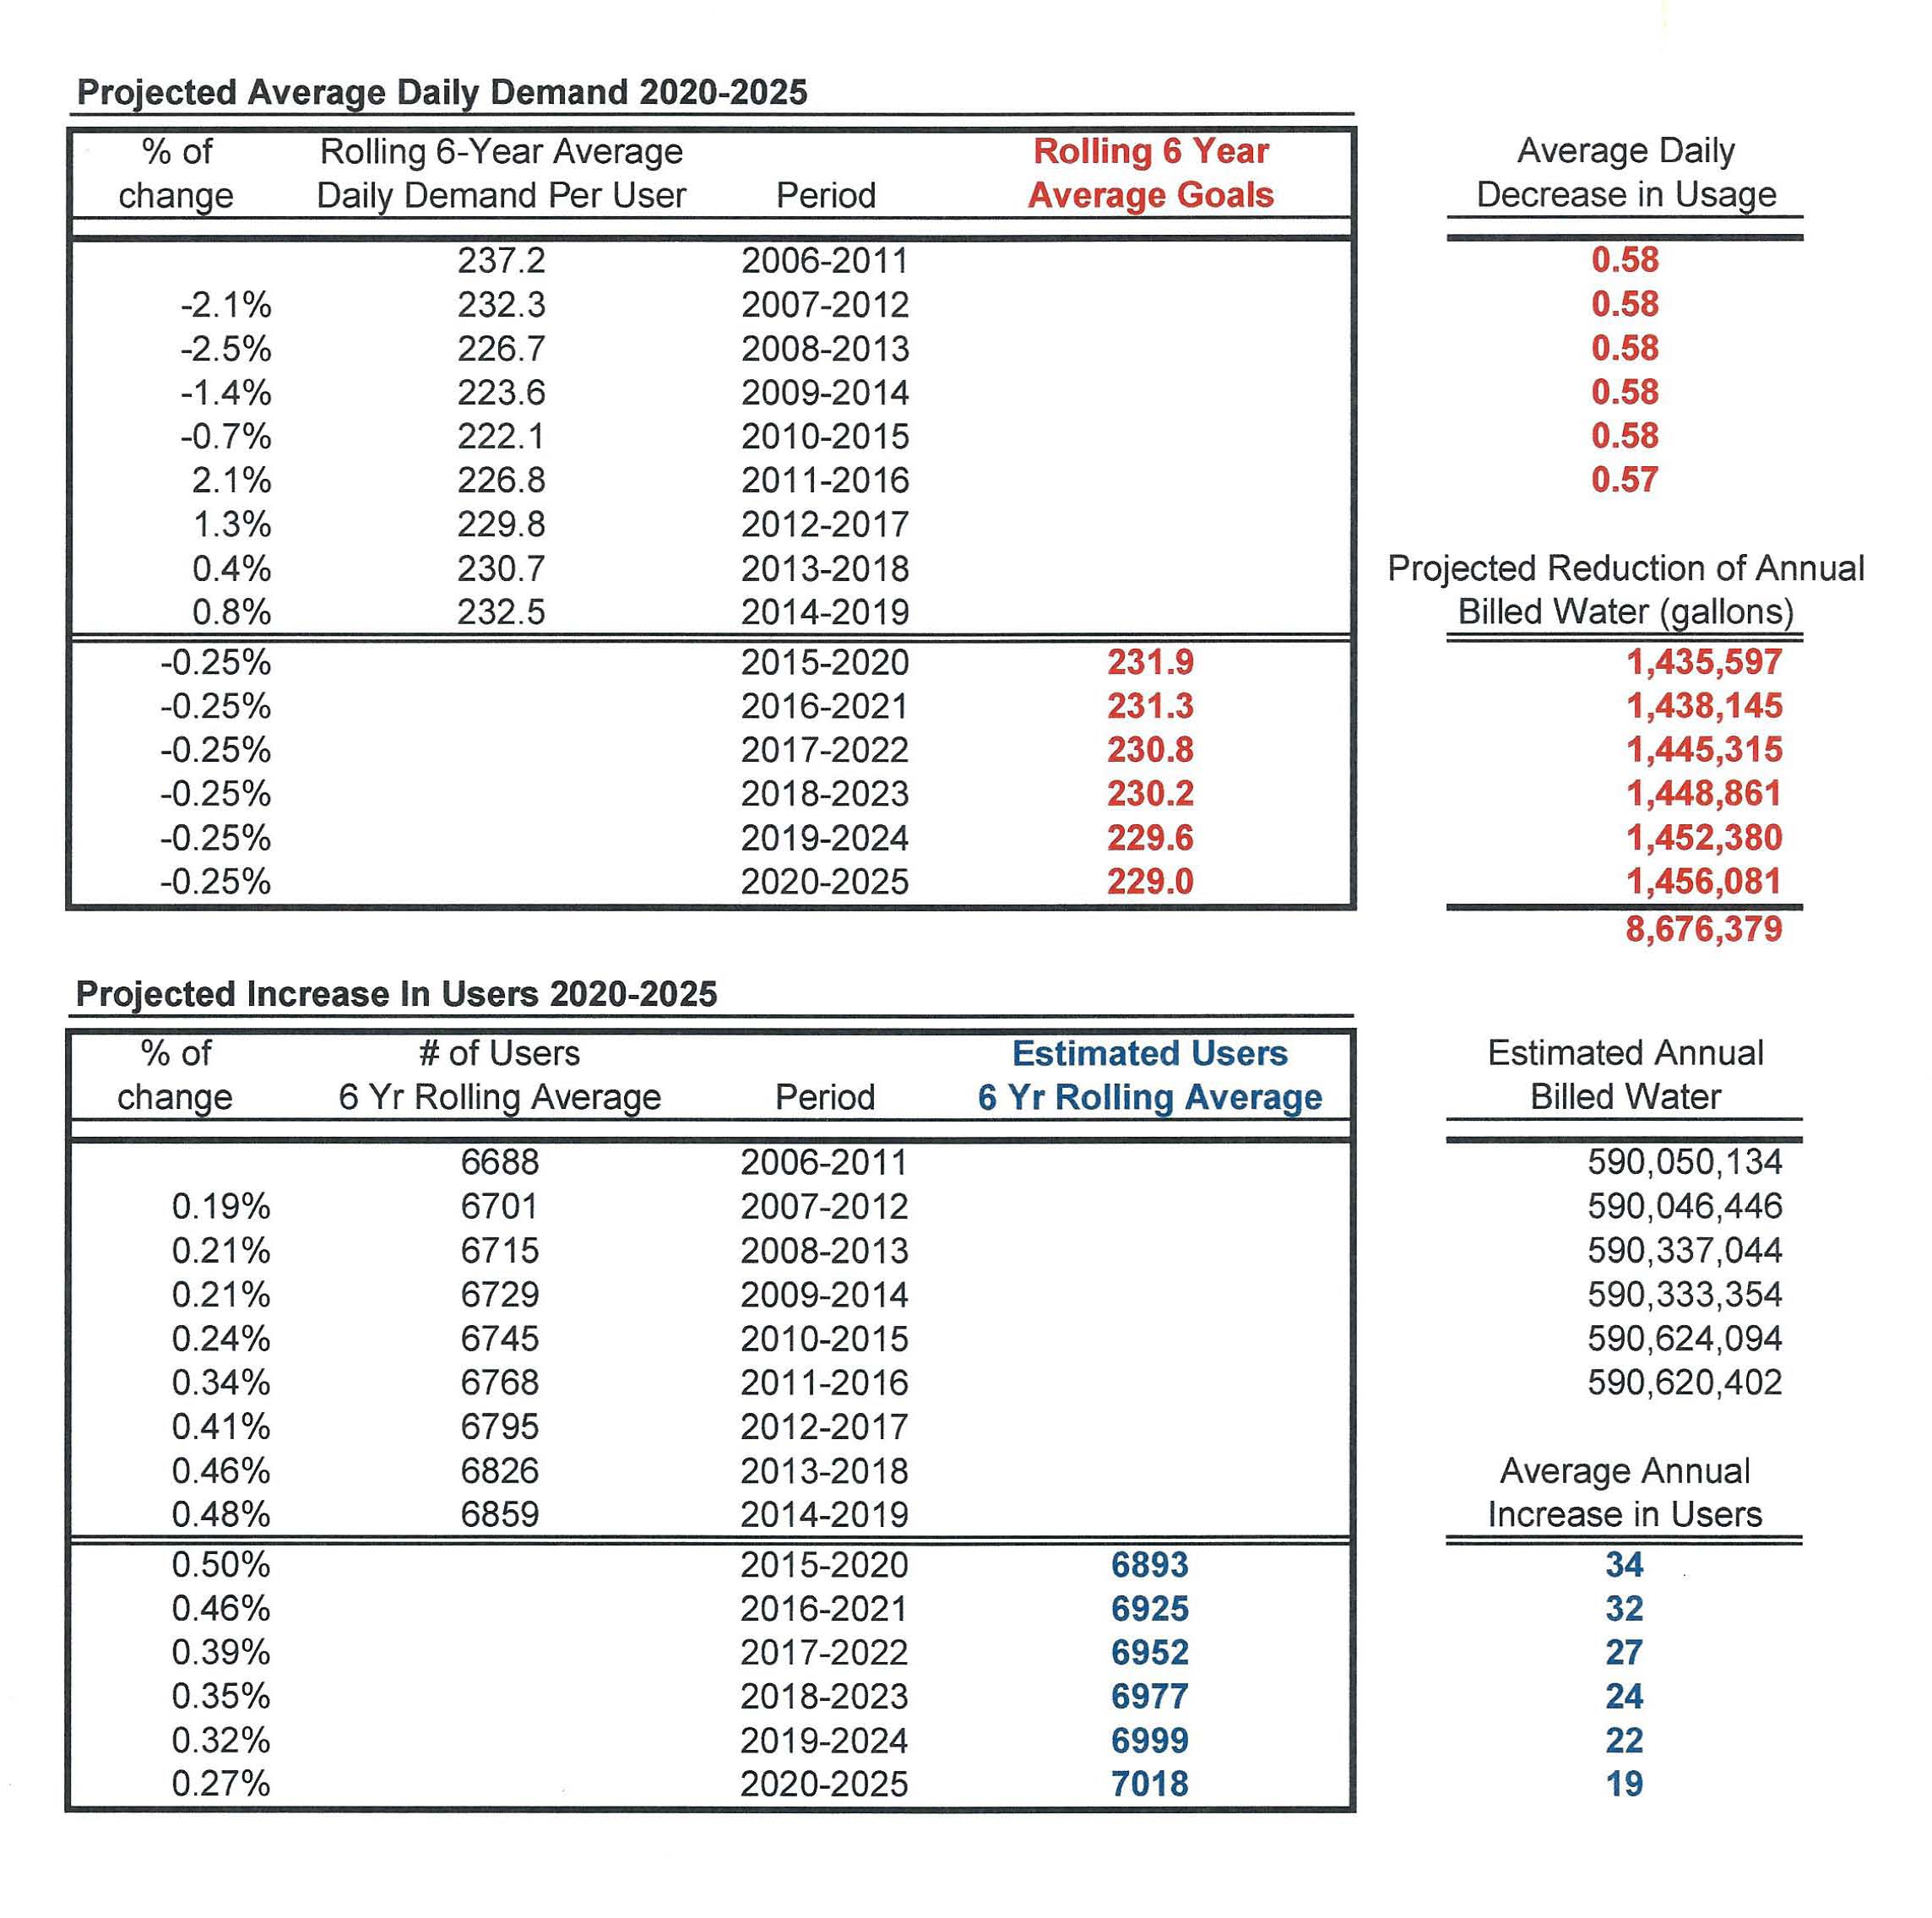
Presented below is a chart detailing historic information relating to Summit’s ADD per user and increase of users from 2000-2025 based on a rolling six year average.  Also provided is an estimated decrease in the ADD per user, reduction of annual billed water, as well as an estimated increase of users and our anticipated billed water for the planning period of 2020 to 2025.


Downloadable PDF Link Below

Summit Water’s Proposed Water Use Efficiency Measures and Goals


--------------------------------------------------------------------------


Natural Yard Care brochures from Tacoma-Pierce County Health Department

The following Adobe "PDF" files have been supplied for download if you wish.

These files are provided by Tacoma-Pierce County H. D.

Natural Lawn Care

Soils & Mulch

Integrated Pest Management

Planning & Planting

Watering Wisely

5 Steps to Natural Yard Care


Webmaster: dscott@summitwater.org

Home ]